Introduction
I’ve been a big fan of solar energy for years, reading every issue of Home Power magazine, and every other thing I could find. But it always seemed way out of reach for various reasons, until this year that is.
Our consumption
We’ve been tracking our energy use over the years pretty closely. As we slowly moved lighting to LEDs and improved house ventilation and air sealing, the usage kept dropping along the way, until we arrived at the current baseline of just over 300 kWh a month most of the year. During the hot and sticky summers though, we still had large peaks due to air conditioning.

Usage over the years
Averaged over the last 8 years, we’ve used about 5400 kWh annually.For our area, using a proverbial rule of thumb, that would be about the size of the system in Watts to cover our needs and maybe even send some energy back to grid.
Available incentives:
At the time we’ve priced out the system, there were three types of incentives available in our area:
- Direct to installer NYSERDA grant (under PON2112) at $1.30 per Watt of installed capacity. The figure is subject to change until you are locked in, and has been steadily dropping lately as demand for solar picks up. As of November 3 2013 that’s down to $1.15/W
- Federal tax credit of 30% net cost (IRS form 5695)
- NY state tax credit of 25% net cost (NYS form IT-255)
System design:
Panels and inverters
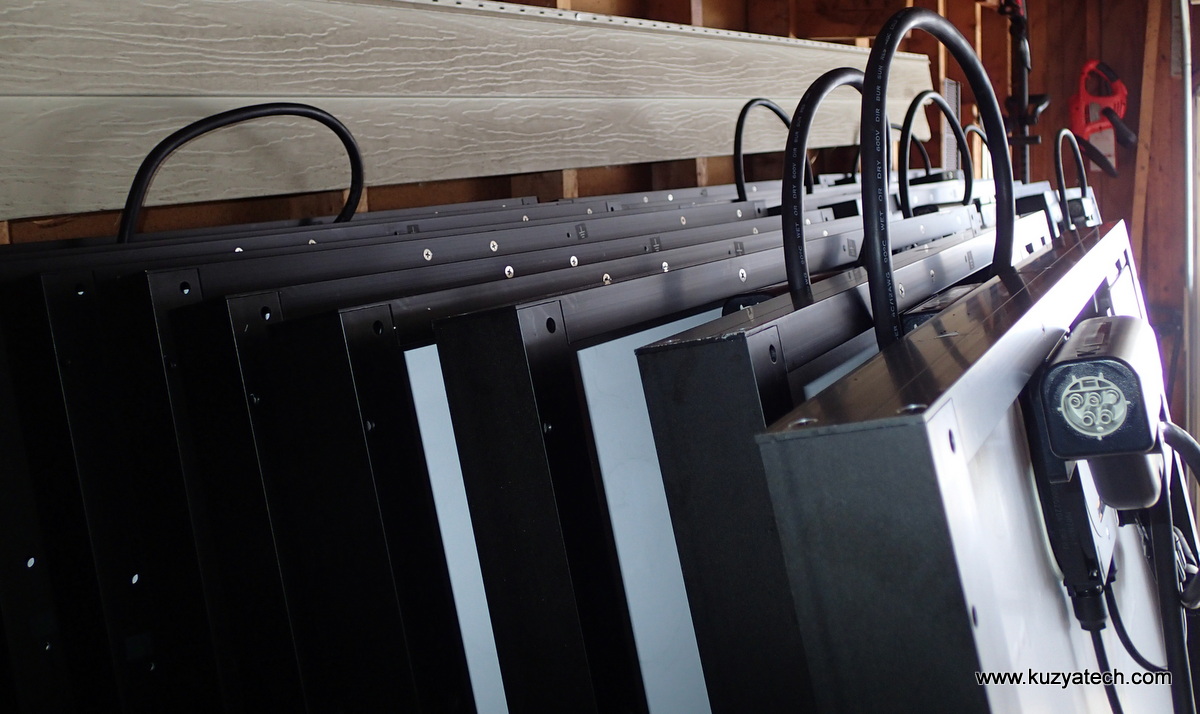
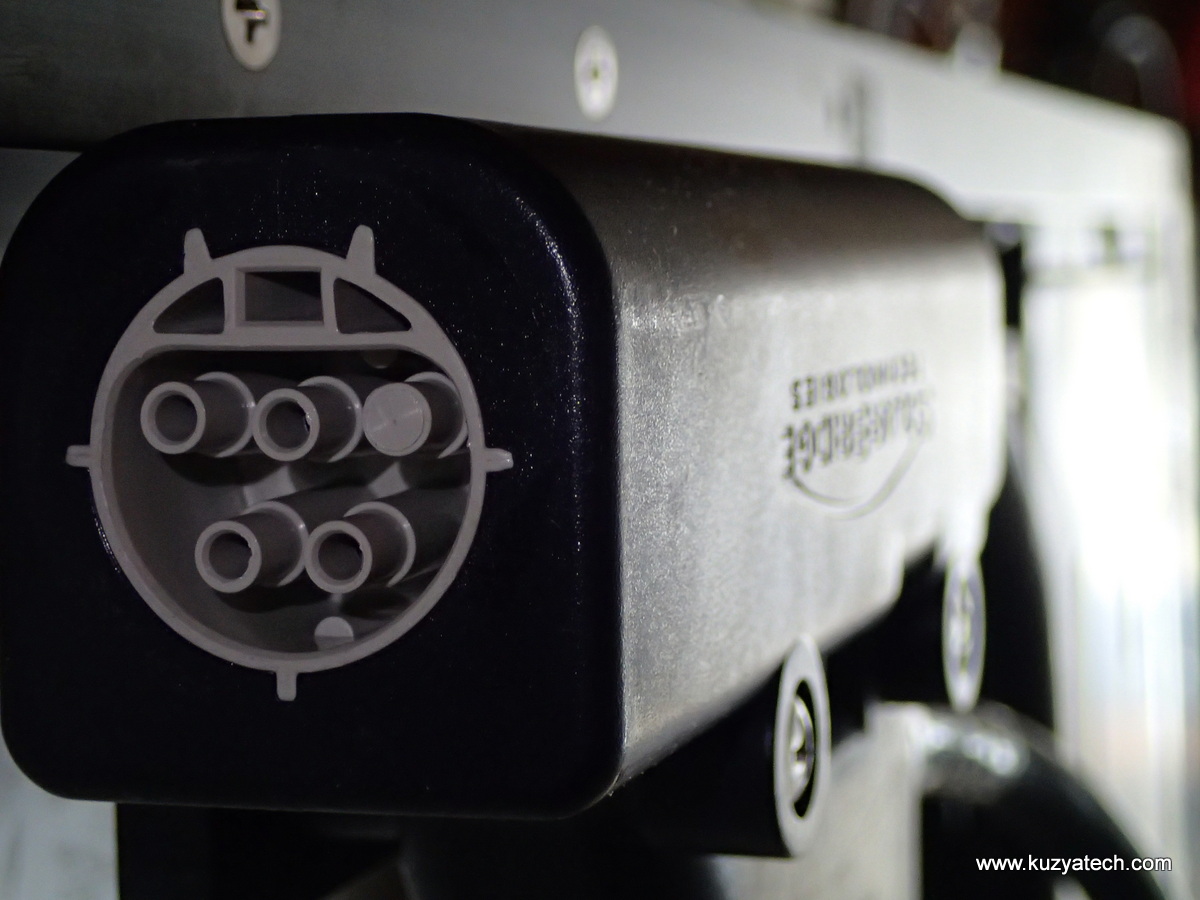
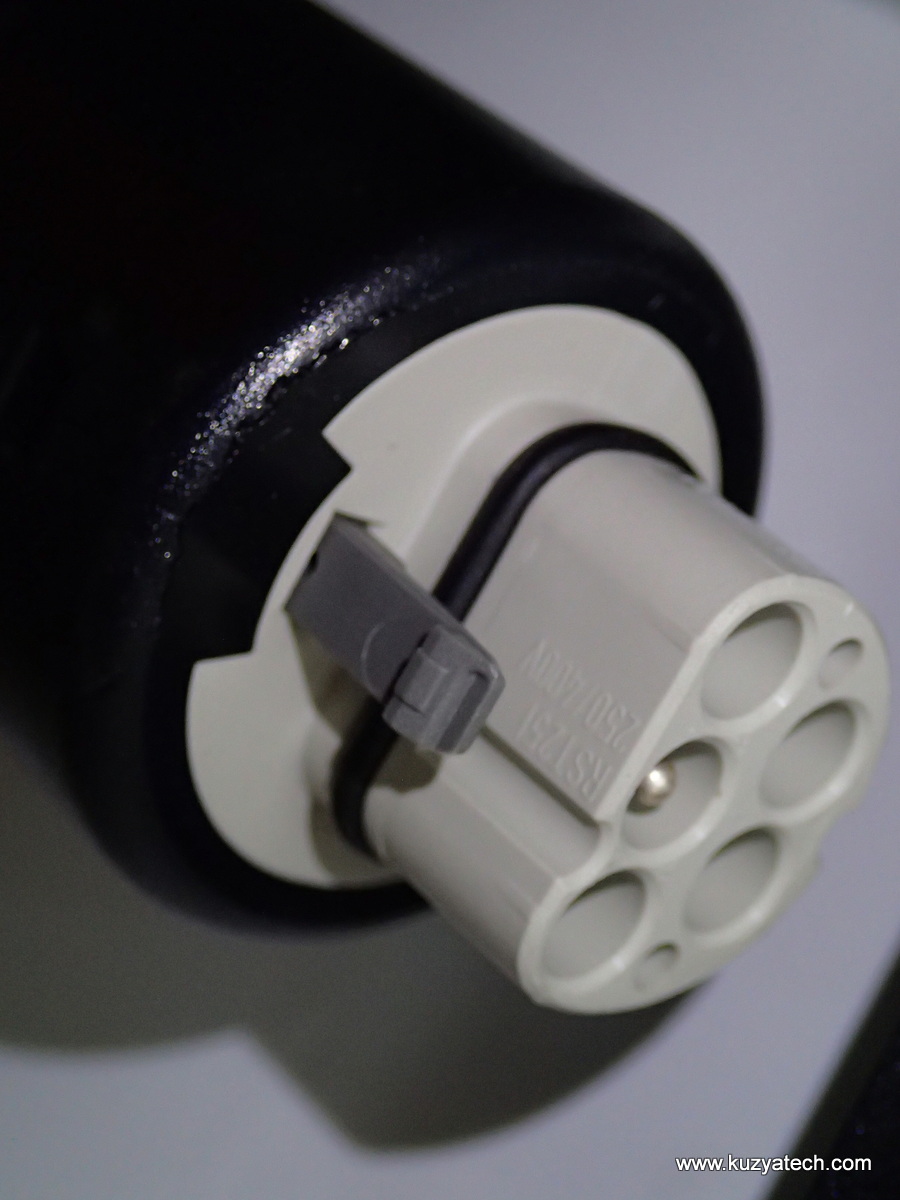
Working with a local solar installer (Shawn Lessord from Renewable Rochester), we looked at a few options. One was a traditional DC string setup with a single inverter, the other- a distributed microinverter configuration using Sunpower 240W ACPV panels. Naturally the second option appealed to me for multiple reasons, despite a slightly higher cost. With a typical setup, you connect a bunch of panels in series and run one or two circuits at a fairly high DC voltage to a central inverter. That works well in ideal cases. On our particular roof, with trees and chimneys nearby, shading will be an issue. As soon as one panel in a string is shaded, it affects the current going through it from the other panels, reducing total production. With microinverters, each panel is a low voltage 40-50V DC source, connected to a small inverter right at the panel. Being right at the panel allows for an efficient MPPT (Maximum Power Point Tracking) operating to extract the maximum available current for a given set of conditions. Each panel then makes its own 240V AC, that’s synchronized to the grid. Panels literally plug into each other via weather-tight connectors on the back and then AC voltage from each array is run down a conduit to a combiner box.
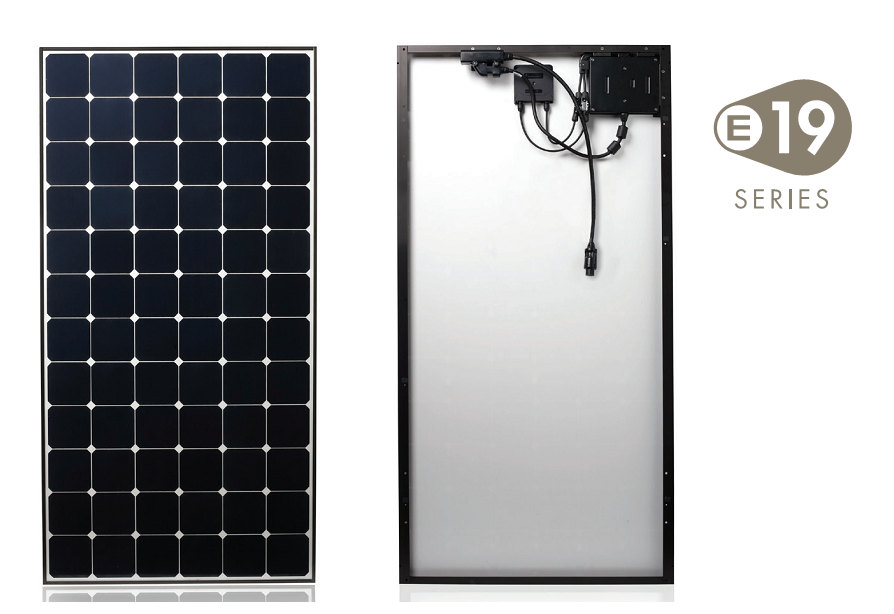
Sunpower ACPV image form the datasheet
Another feature of these panels is the design that makes all connections from the back, eliminating foil traces across the cells and increasing efficiency. Between the cell construction and interconnects, these cells are 19% efficient.
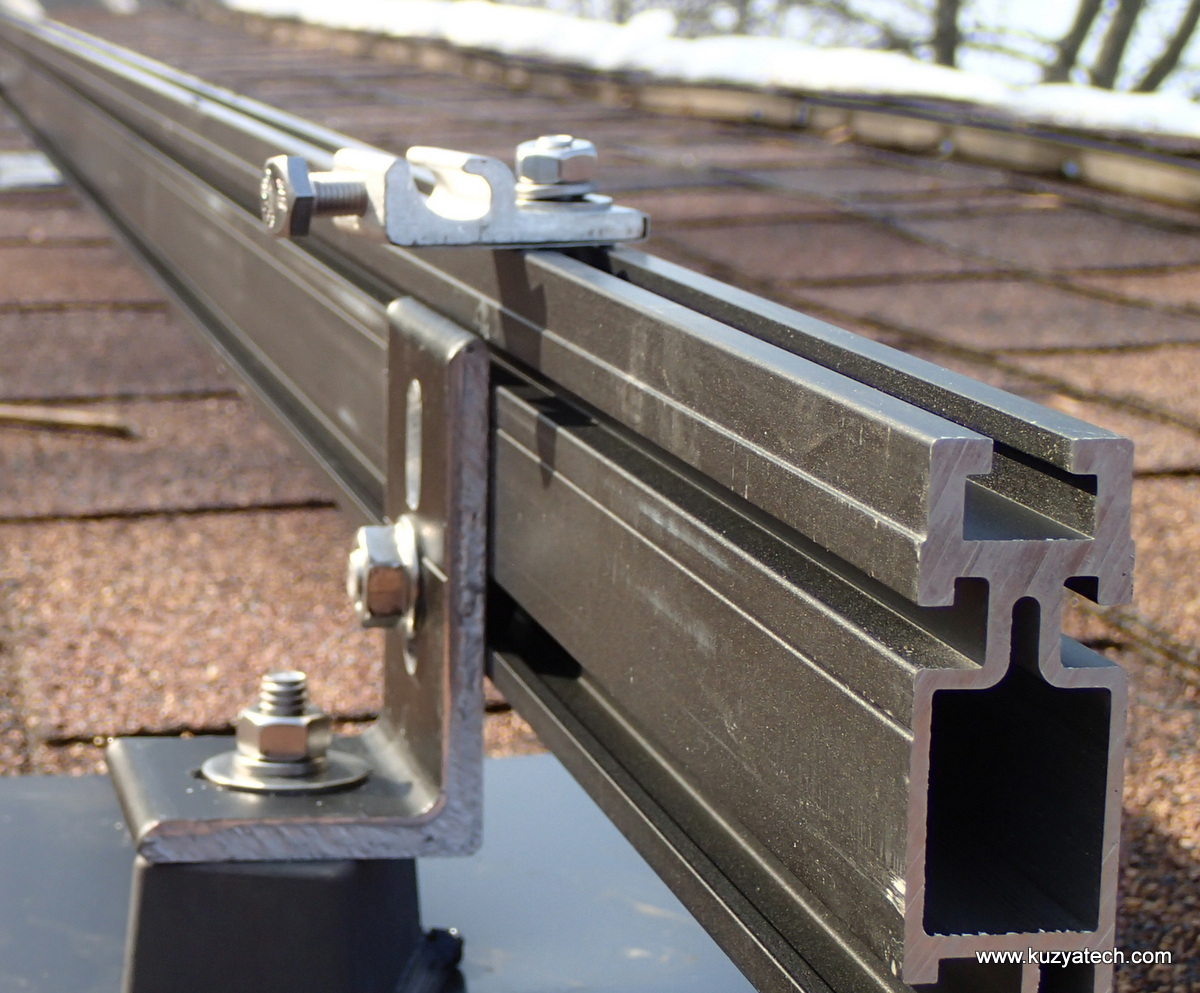
Racks and mounts
The installer suggested Sunpower SPR-SM-4 racking system made by UniRac and Quick Mount PV mounts for our asphalt shingle roof.
System diagram

System diagram
Monitoring.
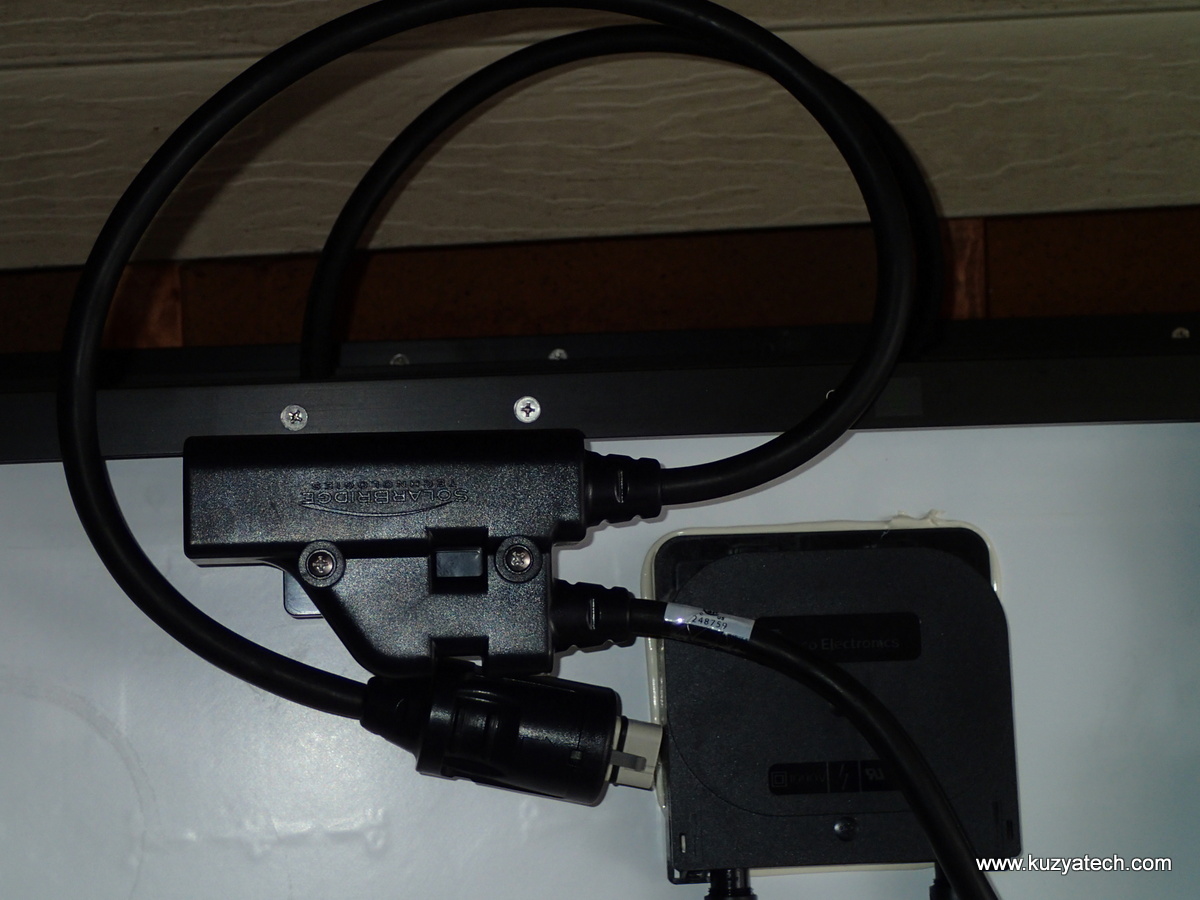
Each microinverter communicates over the AC line with the monitoring box inside the house. The box itself uses Ethernet to connect to the house network. Oddly enough, that link goes over powerline as well, through a second set of powerline adapters.
Grid connected- plus and minuses
Being grid connected has its pluses- we can always rely on it to supply energy we need, should the system not be producing enough for our needs, or when sun is out. It also has its minuses- should the grid go down, our inverters must shut down within a short time to protect repair workers and also to avoid damaging themselves trying to power an essentially infinite load. This also means we have no backup power, as this system topology does not lend itself too well to adding battery banks to it.
Net metering
Our utility interconnect contract supports net metering, so every month our produced energy is subtracted from energy consumed, and we are billed for the difference. On months when production exceeds consumption, the extra is “banked” by the utility and accumulated up to a year. Then on a contract anniversary date the total is calculated and account is reconciled. Or at least that’s the theory- we will see how it actually works
Process and timeline
Step 1- Site survey (9/17/2013)
The process started with the installer coming over to do a site survey. We walked around the house, looked at the electrical connections, roof condition and access to things, then went on the roof. From there a special PDA (Sun Eye from solmetric) was used to evaluate the conditions. The SunEye uses a bunch of integrated sensors (GPS, inclinometer, compass) and a camera to figure out roof pitch, heading and shading. It then crunches the numbers and generates and estimate of how much sun the roof will see:

Solarmetric data from our roof
This indicated that our site is a good candidate for solar access, so we proceeded to the next step:
Step 2: Paperwork (9/25/2013)
This step involved us supplying electric bill for a few previous months and then coming to sign a giant pile of papers: installation contract, utility interconnect agreement, NYSERDA forms,and a bunch of others I probably forgot about by now. We put down a small amount of money and prepared to wait.
Step 3: Waiting
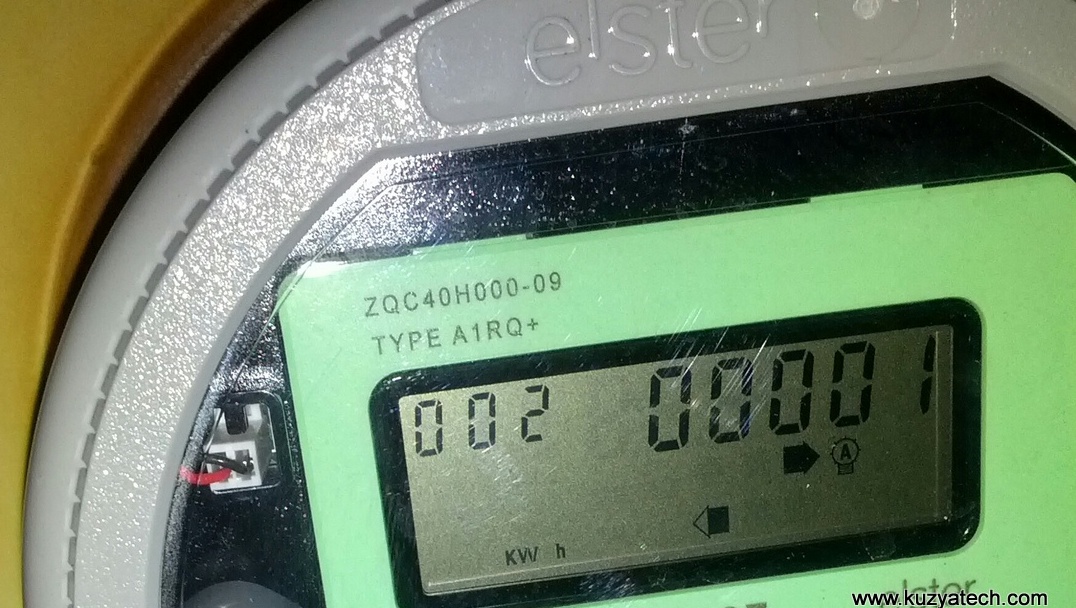
For a few weeks it’s been quiet, so I’ve been entertaining myself by reading up on system components and NYSERDA funding woes. I also had a local arborist trim some branches off a maple tree that had a potential to cause shading. On 10/17 I came home to signs of brief power outage. I shrugged it off and went on my merry way. Then the weekend after I noticed a shiny new digital electric meter in place of my 20 year old mechanical. Well, that explained the outage. The new meter had two registers: #1 for consumption and #2 for production.
-
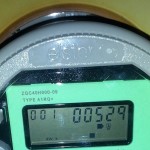
- Screen 1 is for consumption
-
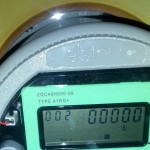
- Screen 2 is for production
At about the same time the utilities online readings submission page changed to include two readings as well.
10/19: letter from utility arrived, stating an OK to proceed.
10/29: NYSERDA notified our installer that the project has moved to a “Received” state, meaning the funding for it has been allocated. Two more days and our $1.30 per Watt incentive would’ve become $1.15 – talk about close call!
11/5: NYSERDA: issues preliminary project approval allowing the installer to proceed.
11/7: Town emails me asking to come get my permit. Permit fee- a grand total of $60. Way to go. I’ve read horror stories of towns banning solar installs or charging through the nose. Not ours.
11/26: Official NYSERDA approval. Panels are due to arrive so we schedule the install date on 12/4, pending weather etc.
12/2: First huge snow storm of the season arrives, dumping a foot of snow. The install looks less likely than before. The installer crew leaders came over for final checks and promised that not to be a problem. True to his words, the roof is shoveled clean next morning to allow it to dry for a day.
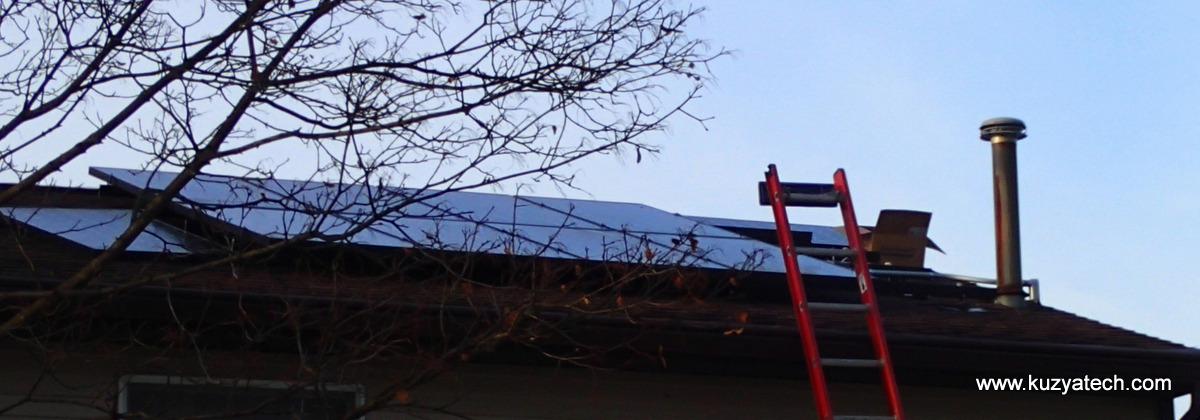
Step 3- The installation (12/4)
The install was pretty straightforward, so for a crew of four it took less than a day to complete:

“Pallet-o-Panels”
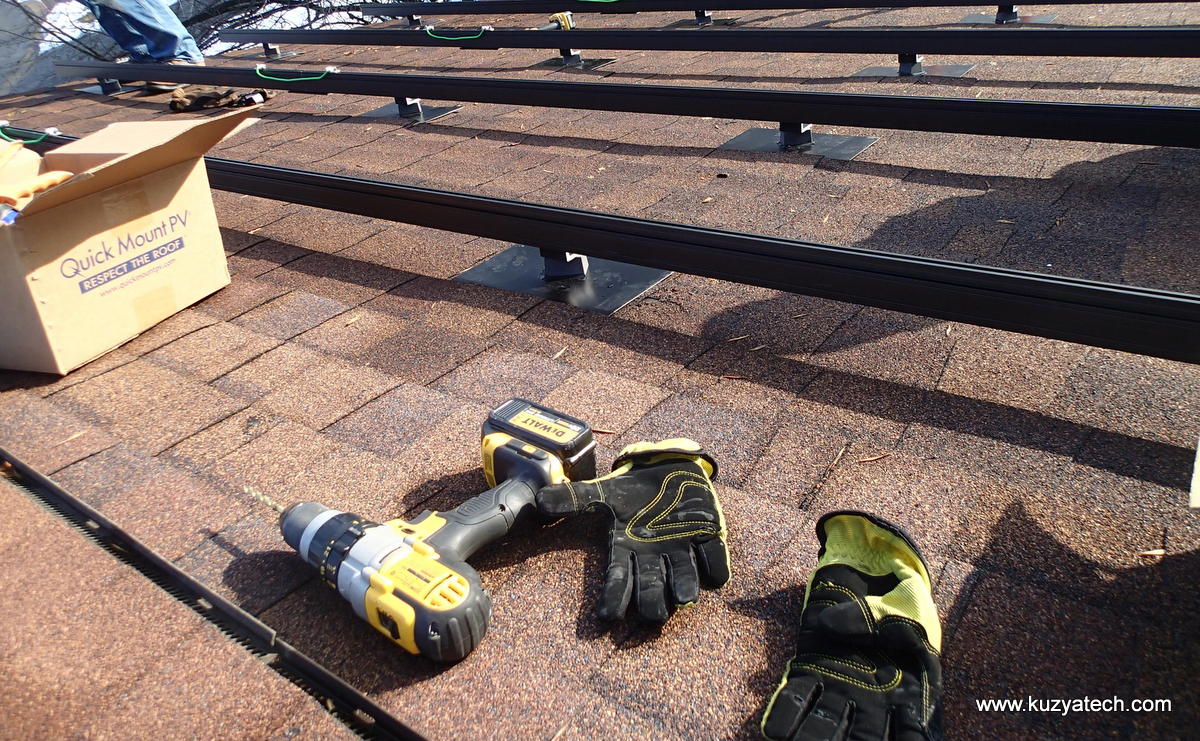
Racking in place
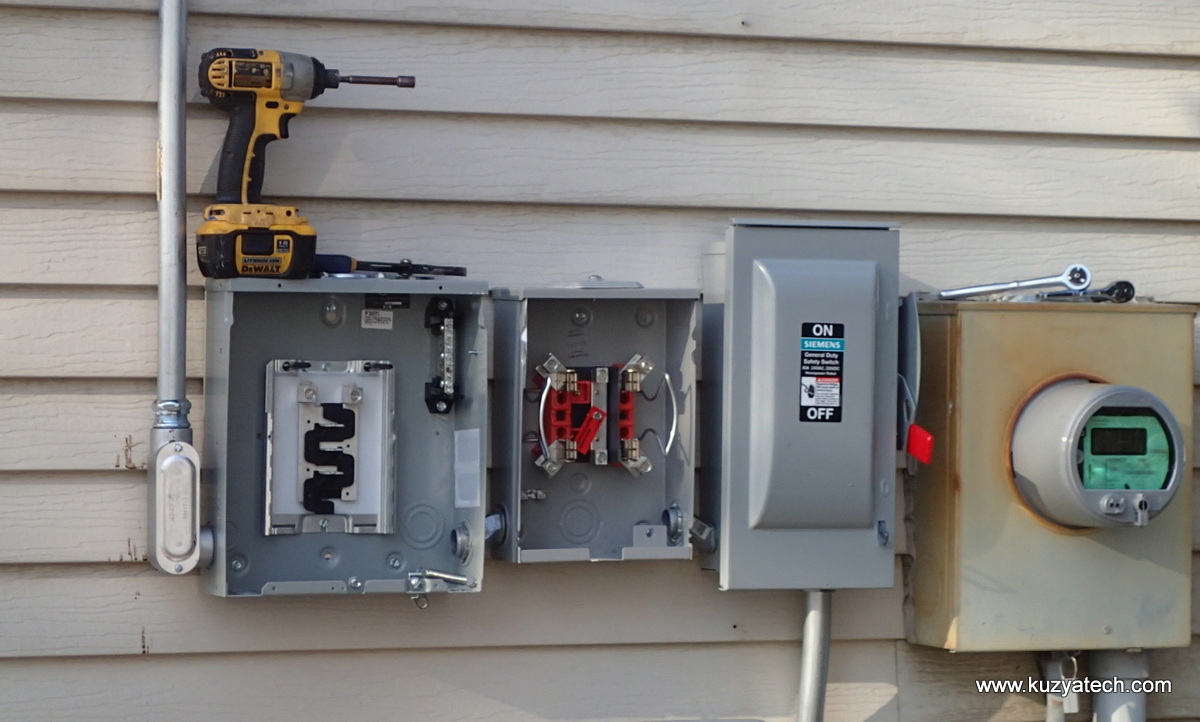
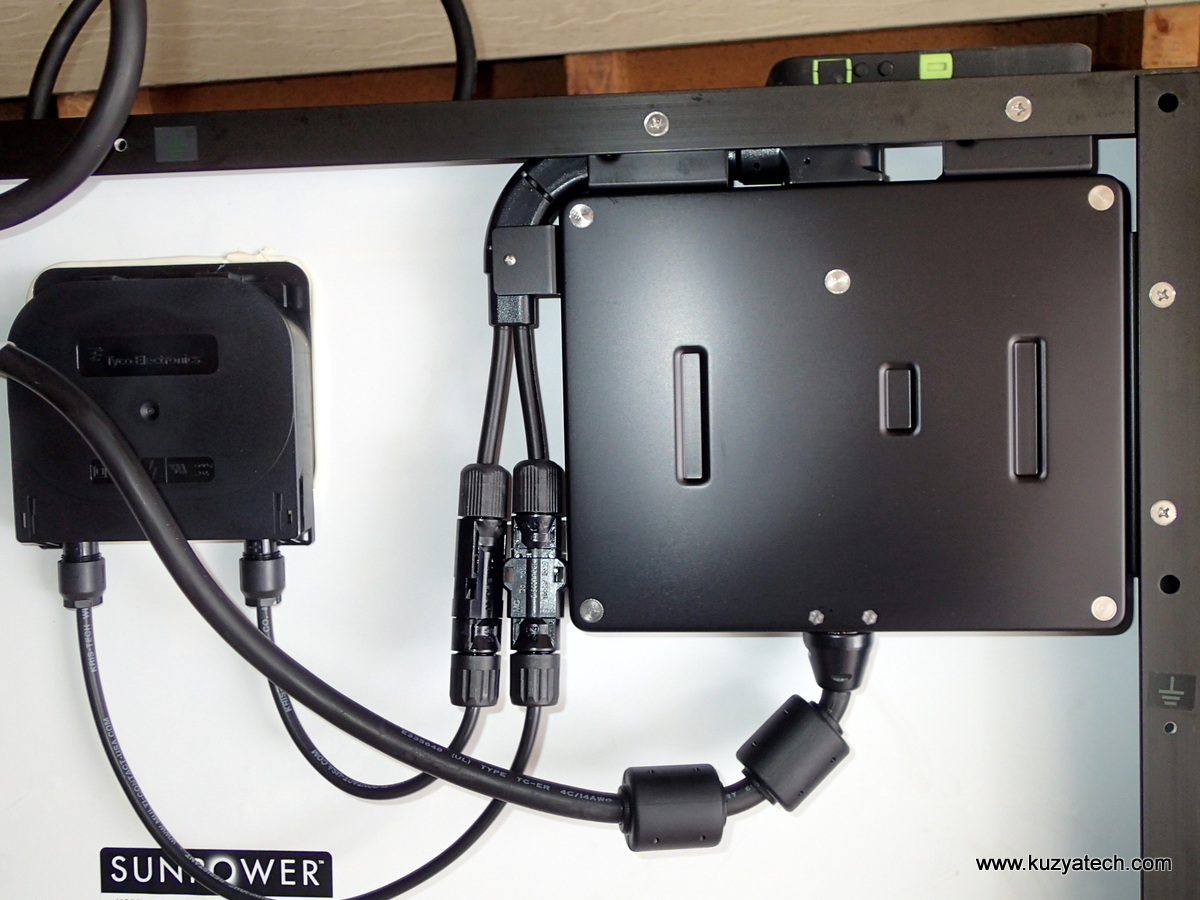
Balance of system, left to right: combiner, production meter, AC disconnect
 One array almost up
Step 4- Inspection and utility approval (12/12)
The electrical inspection passed with flying colors, all boxes were tagged and labeled.
Step 5- Enjoy!
First KWh sent back
First kWh sent to grid
Conclusion:
Overall the process too just over two months from signing the paperwork to having functioning system- not a bad timeline. This public link shows production stats for our system. As days grow longer, we slowly produce more and more energy- currently about half of our daily usage with just gray winter skies. I’ll be posting more about our experience with the system as time goes by.
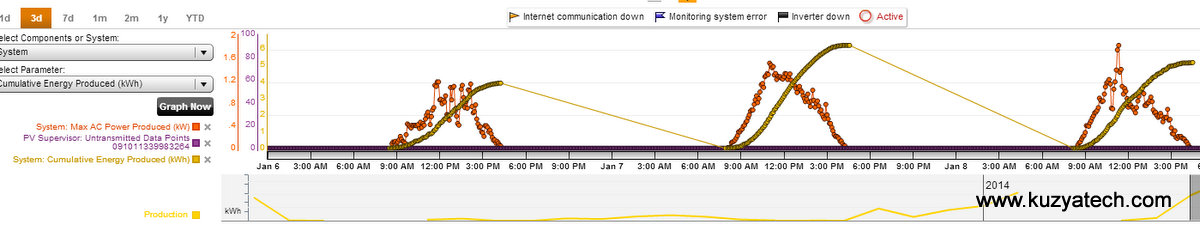
Slowly growing production for early January. The dots show peak power produced- closing in on 1.6-1.8kW, the yellow line is cumulative production for each day, between 4 and 6kWh so far
Great article. Was wondering what your total cost was to have this system installed? How long until you recoup the investment?
Thanks.
It ended up around $8k after tax credits and NYSERDA rebate. Payback will be long- probably 10+ years