Available on Tindie is a new kit by Kuzyatech- an LM3916 based VU meter/bargraph driver.
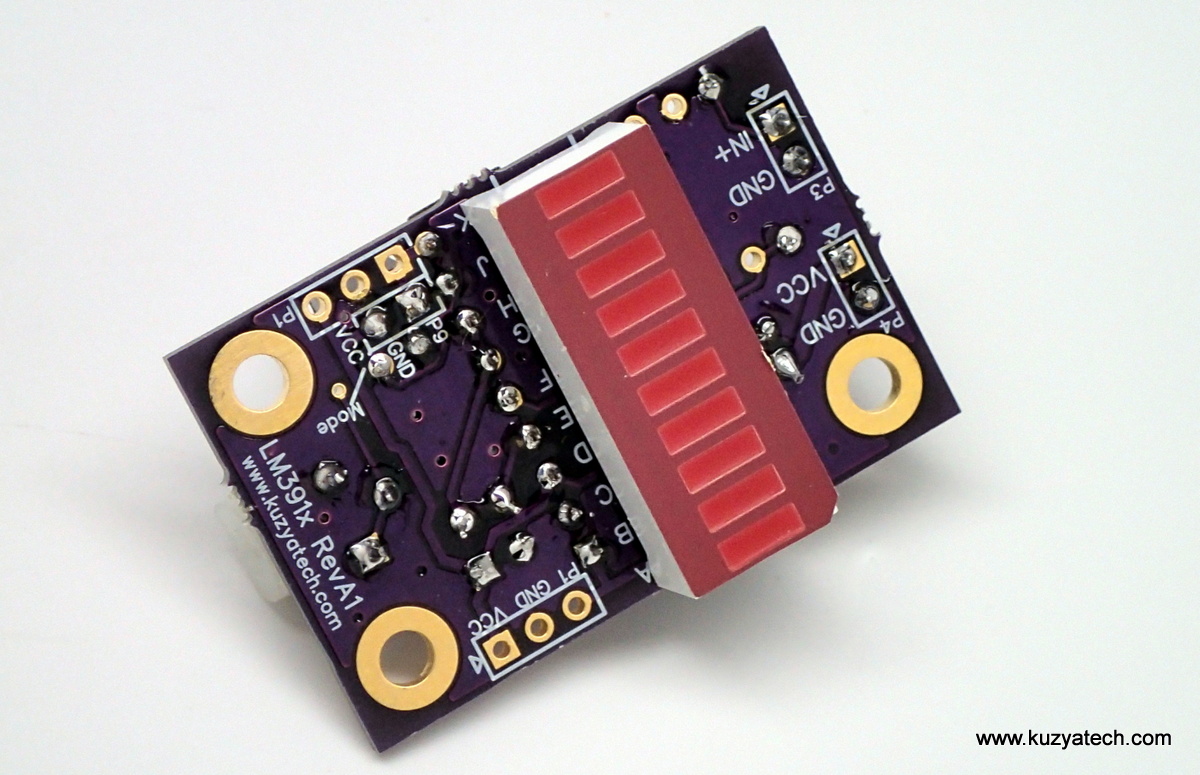
Front view- all parts except the display are on the back. Red version shown

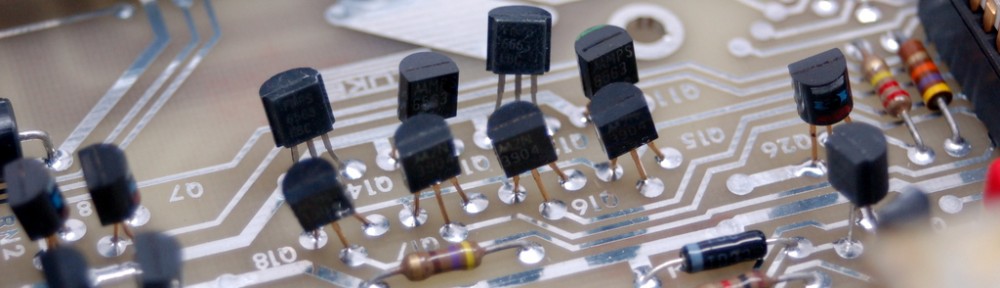
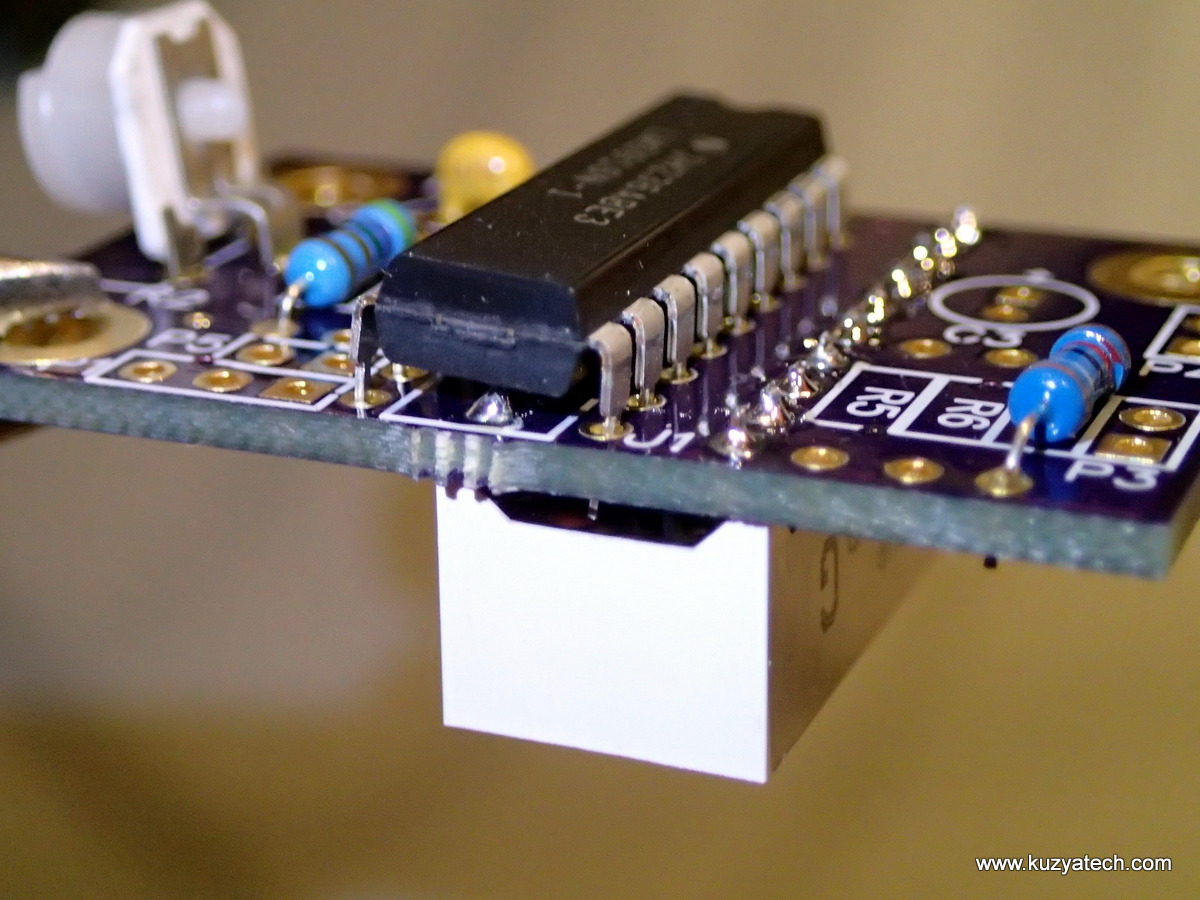
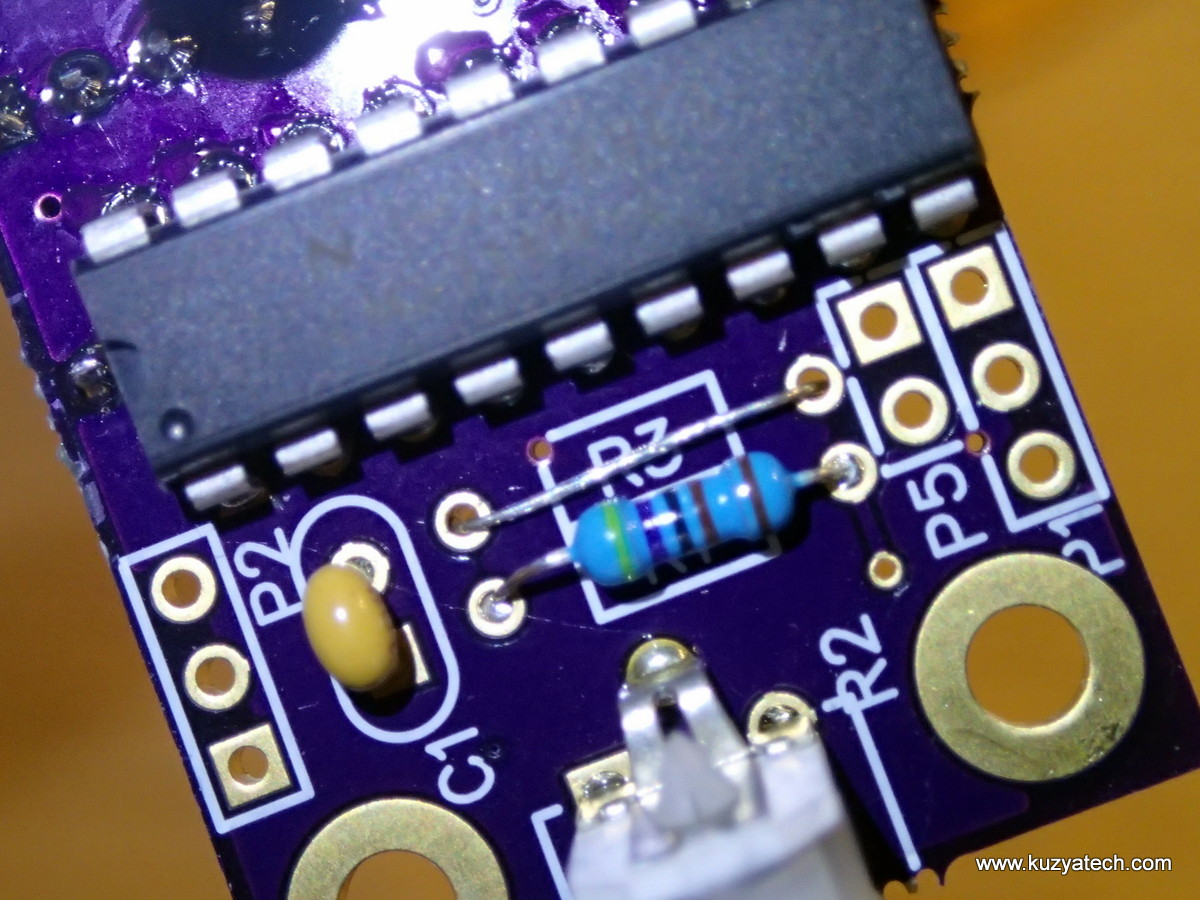
Component side view
Brief description:
This kit builds on a famous LM3916 VU bargraph driver chip from TI/National semiconductor. The chip is essentially a constant current 10 segment driver fed by an array of comparators. It also provides internal reference voltage to set the rail of the precision resistor network feeding the comparator reference inputs. A signal coming in then determines how many signals are lit. Depending on the mode selected, either bargraph or a single dot is displayed. This particular kit is using LM3916, optimized for audio meter applications but could also be used with LM3914 and LM3915 parts to get linear and log response respectively (mainly set by the individual resistance values of internal divider networks).
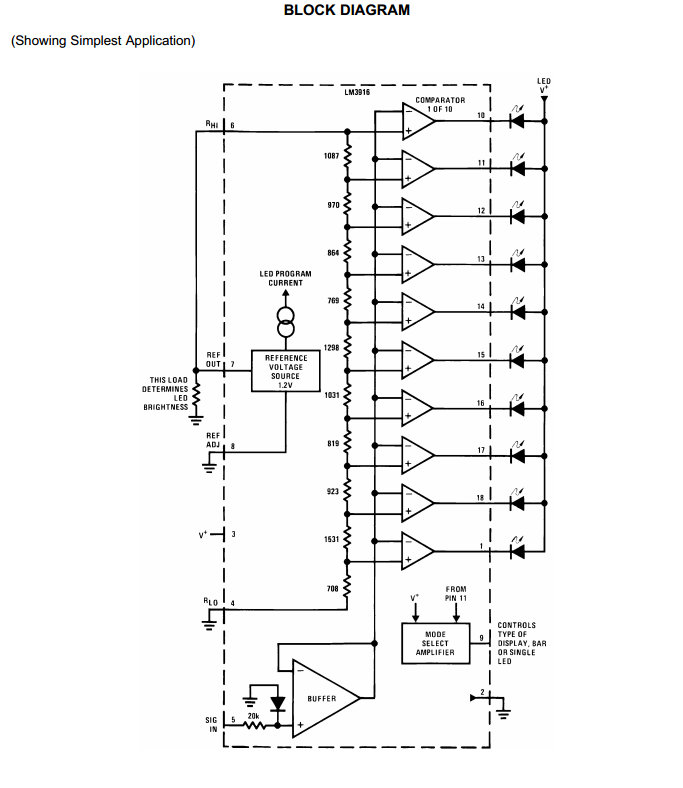
TI LM3916 block diagram
Design features and notes:
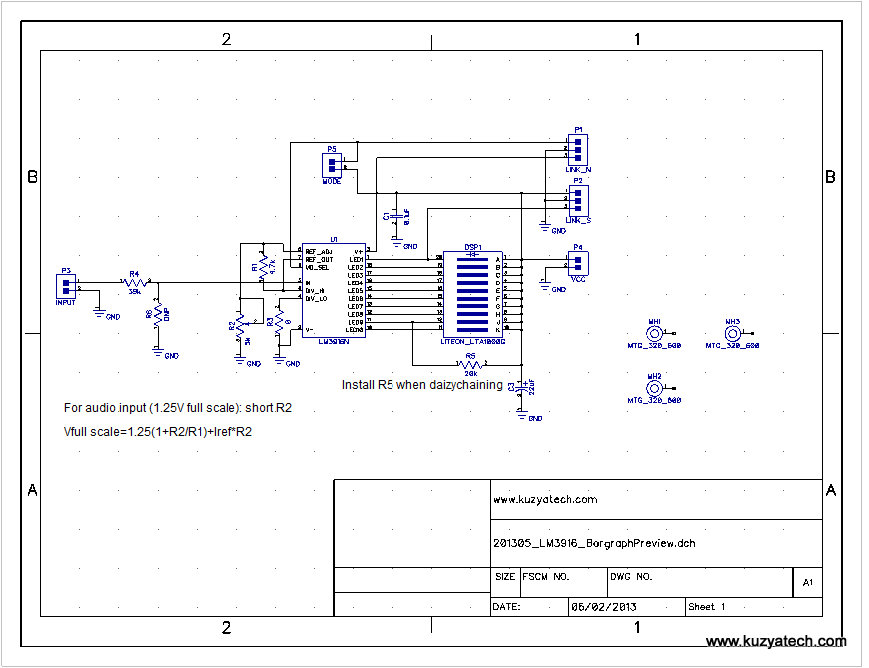
Schematic diagram
- R6 is a placeholder should you require a voltage divider or a filter on the input
- R3 is normally a jumper, but could be used to offset the trigger points up if needed (If building a battery monitor for example, where you need more attention in a narrow voltage range)
- When using with audio input, set R2 to 0 ohms. That effectively moves voltage reference adjust pin to ground, setting top comparator rail to 1.25V
- R5 is only needed when connecting multiple units in a chain. Use P2 and P1 to get at the signals needed for that
- Jumper P5 enables bargraph mode when installed.
- The board will run happily at 5V or even lower. If you change LED current setting and run from higher supply voltage, keep an eye on power dissipation in the driver. (See page 2 of the datasheet for further details)
- Per customer request, here are the input voltage range and power dissipation figures:
The abs max supply is 25V for the chip, but you have to keep in mind power dissipation inside which is a function of LED drive current and number of LEDs on at any moment. See for example http://www.ti.com/lit/
ds/symlink/lm3916.pdf page 11. These chips have junction to ambient resistance of 55C/W and max junction temp of 100C, so you’d take max operating ambient temp, and back out from that how much power can be dissipated. Say you run from 12V and use Red leds with 1.8V forward voltage. The board is set to around 5-6mA per LED. The power dissipation in the chip is then: (15-1.8)V*0.06A or 0.792W. At 55C/W this will raise the chips temp 43C above ambient. At 12V, you’ll only see 33C rise. If you use blue LEDs (2.9V Vf), you’d see 40C and 30C respectively. Measured values: with 15V in, LM3916 had case temp of 62C when running red LEDs and 56C with Blue. Ambient was 18C, so the estimates were pretty close.
Testing:
The better way:
The most controlled and convenient test signal source is a good signal generator. I’ve been using a slope mode on my Rigold DG1022, with very slow (300-500mHz) frequency and and varying symmetry to obtain the effects in the test video
.
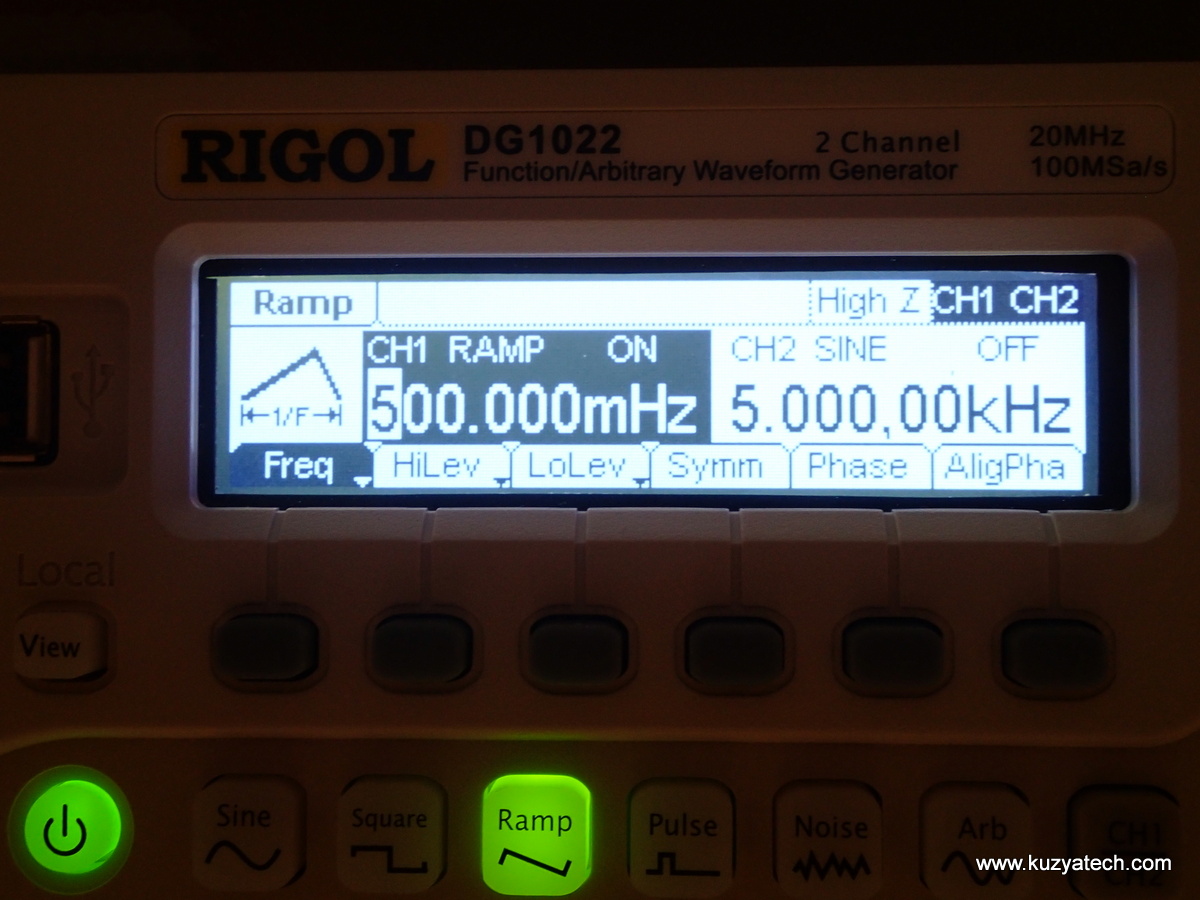
Setting up ARB signal generator
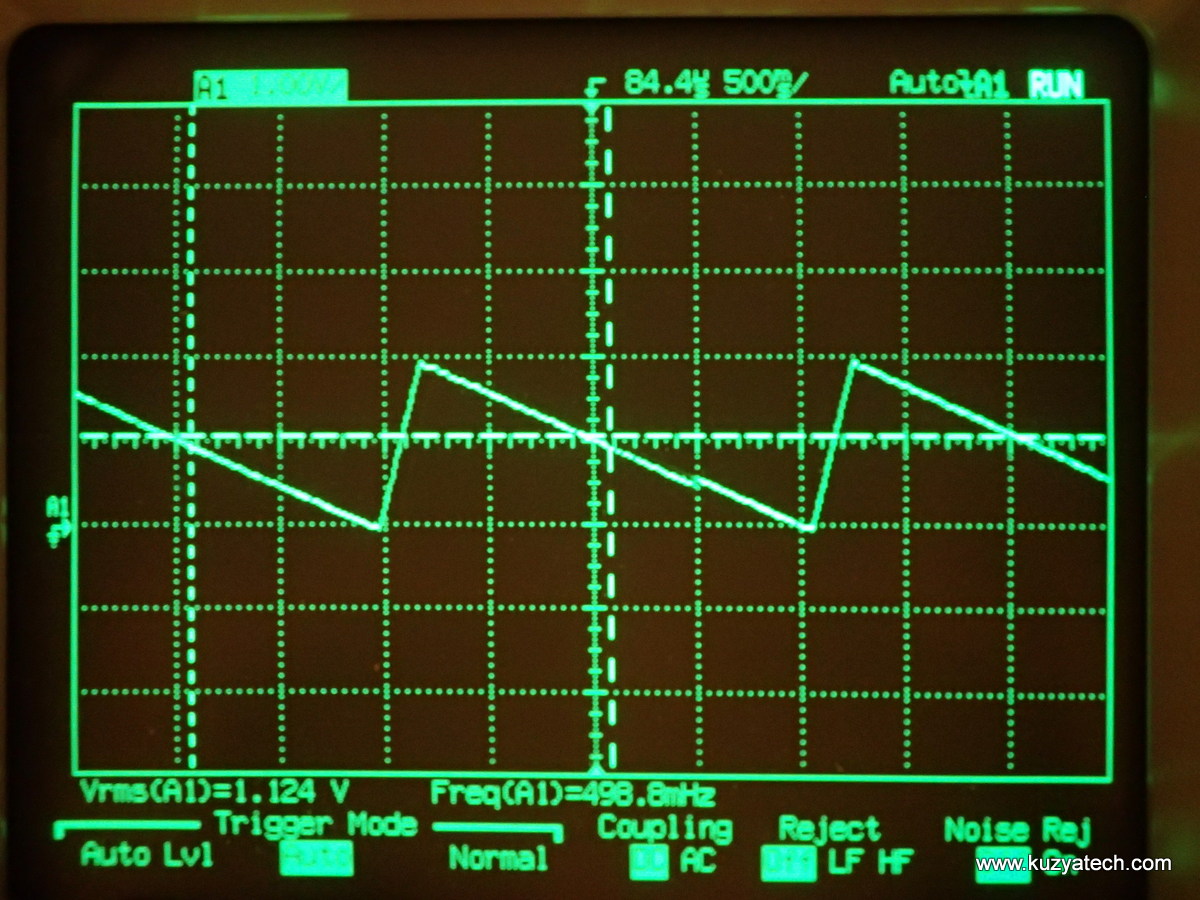
Test signal waveform
The other way:
In the absence of a signal gen, an audio output from a computer can be used. Just make sure to set potentiometer R2 to 0 ohm to get the full range.
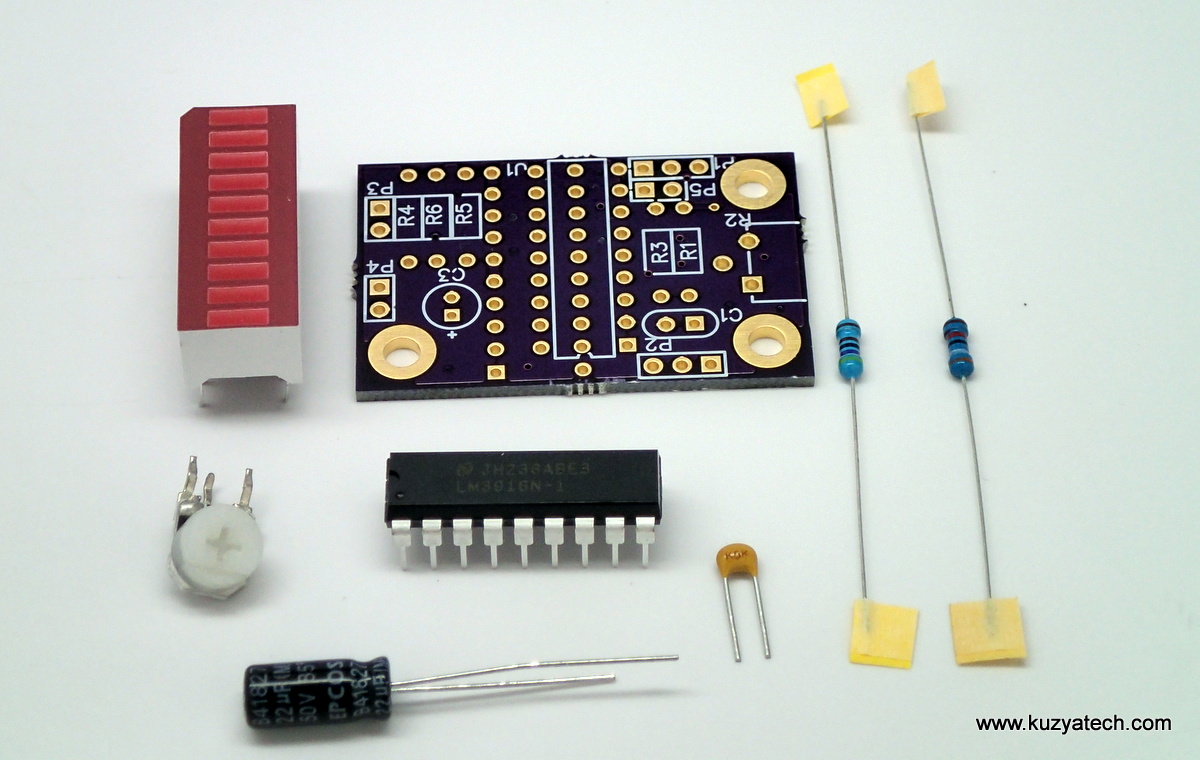
Kit contents:
Documentation:
Assembly instructions in pictures:
There are several unusual steps in these instructions, so please make sure you read them before building the kit!
Install R4
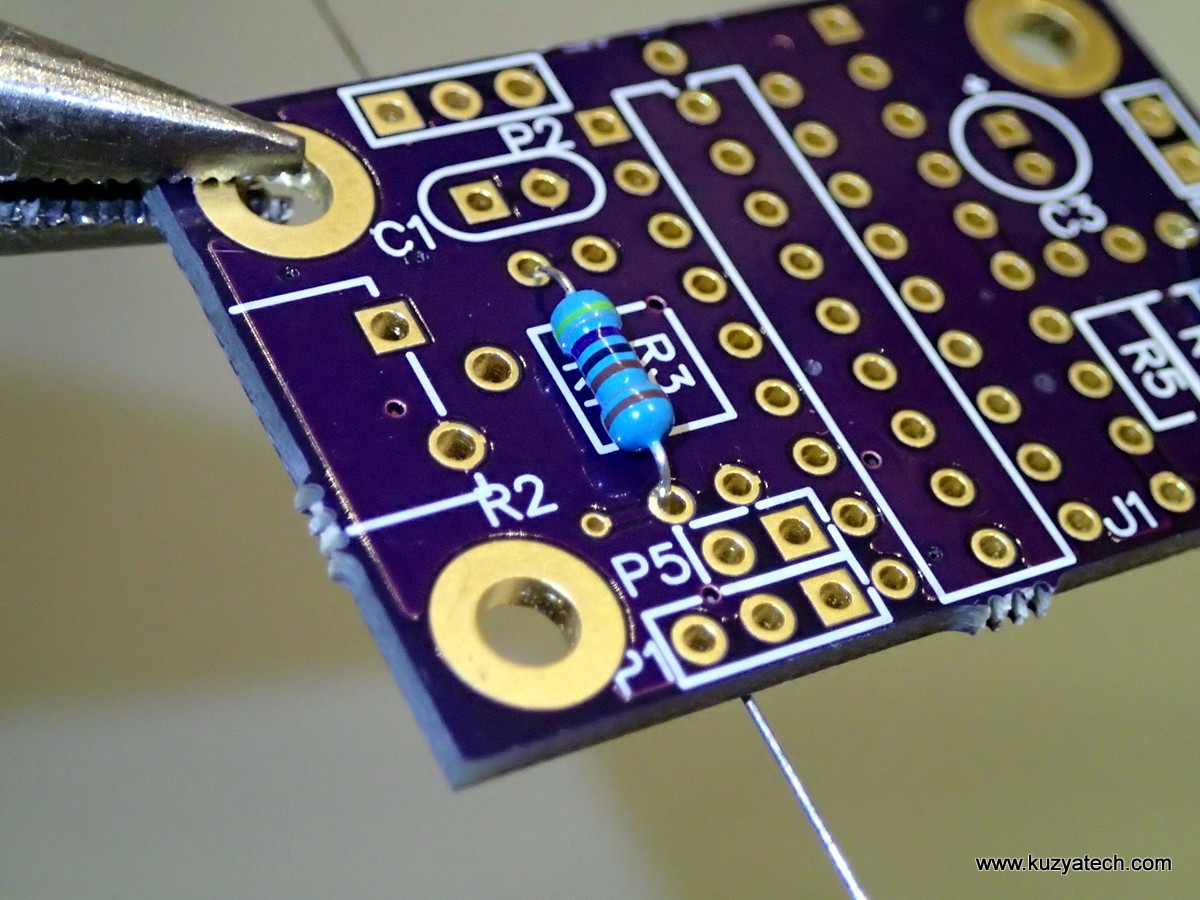
Install R1
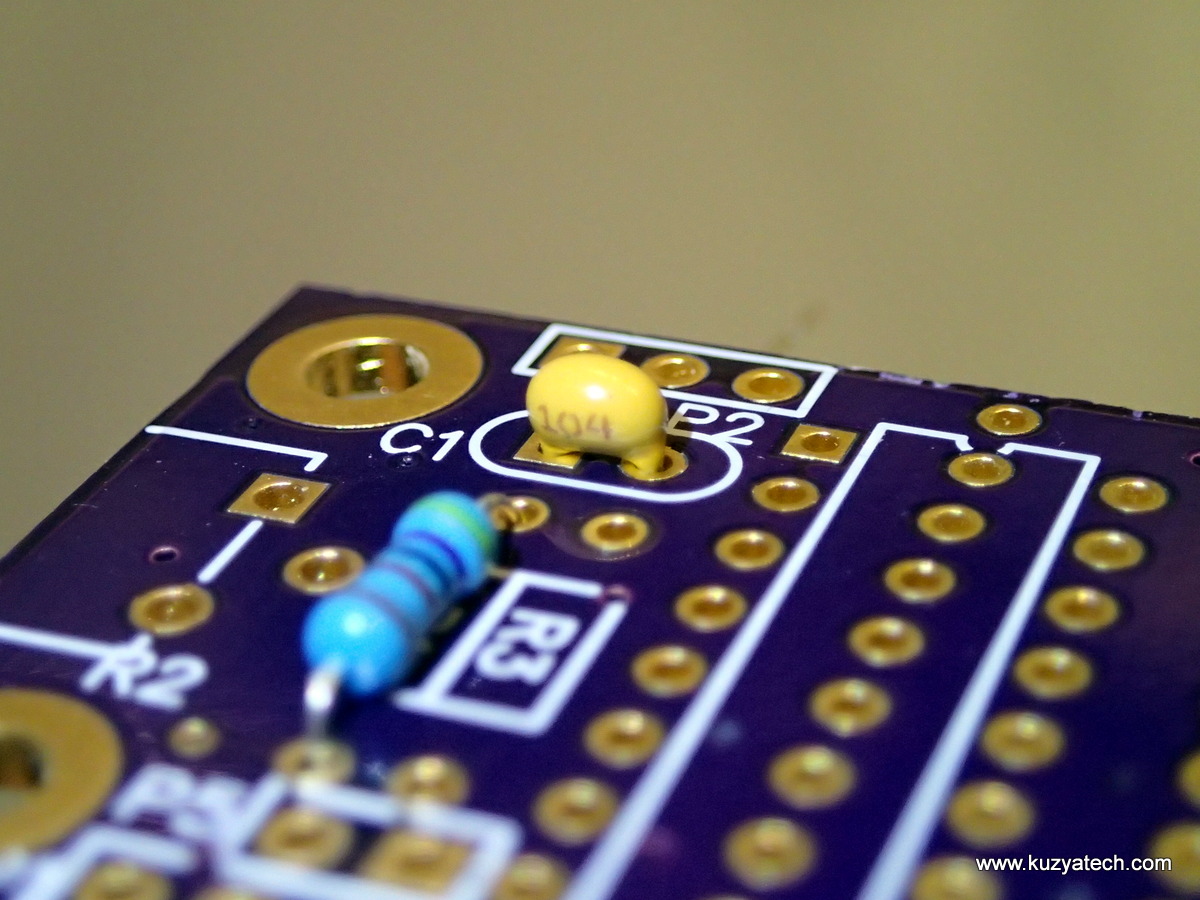
Install C1
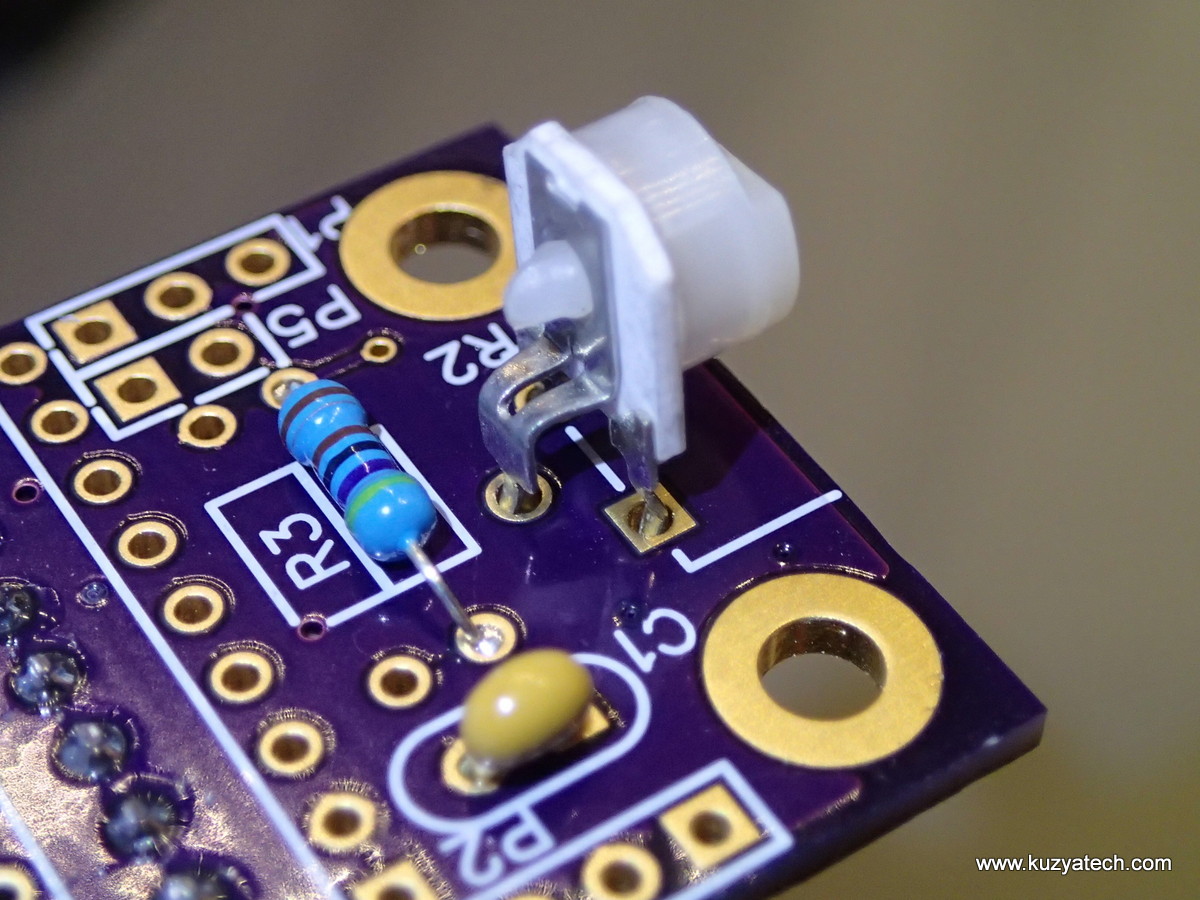
Install R2
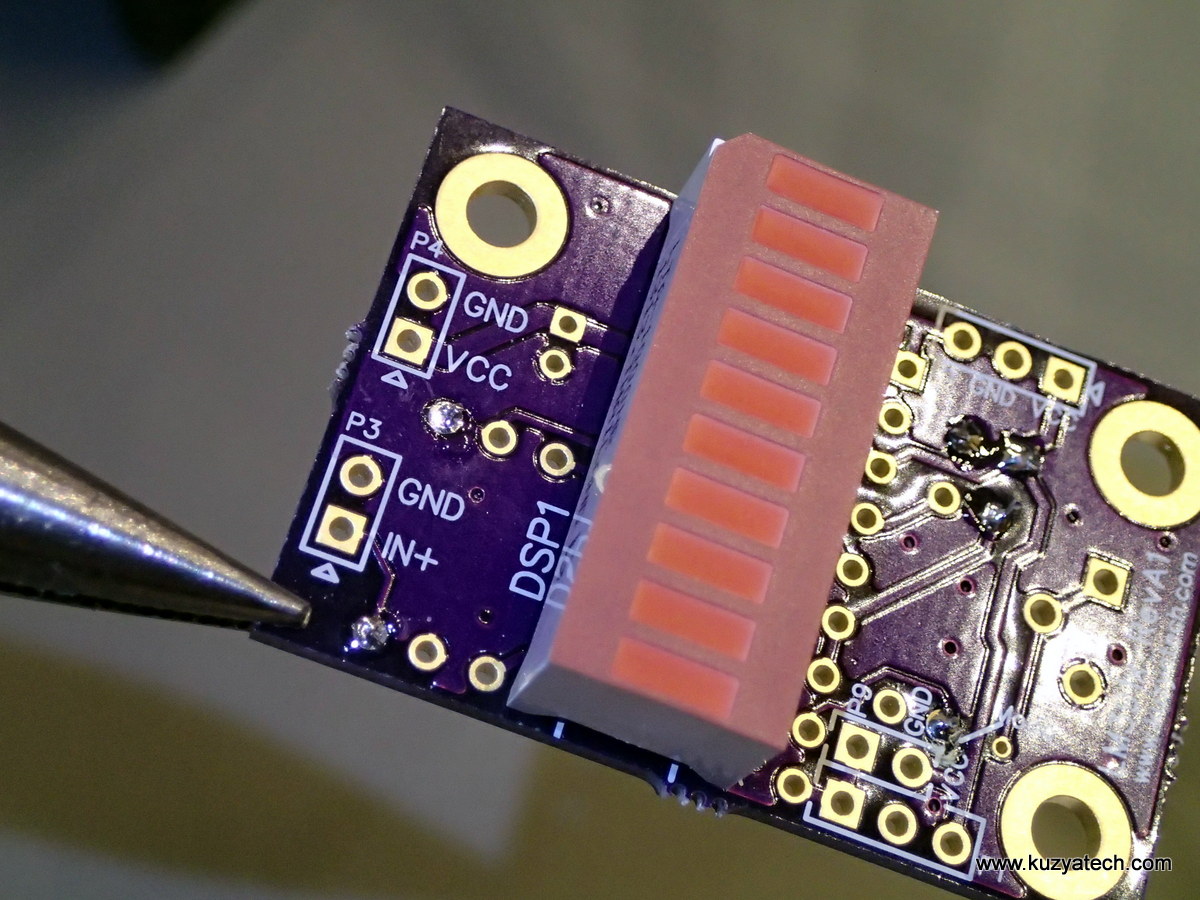
Important- install bargraph array before U1. The corner with a diagonal cut is pin one. Make sure to pay attention to silk screen markings. If in doubt- square pad is always pin one on my boards
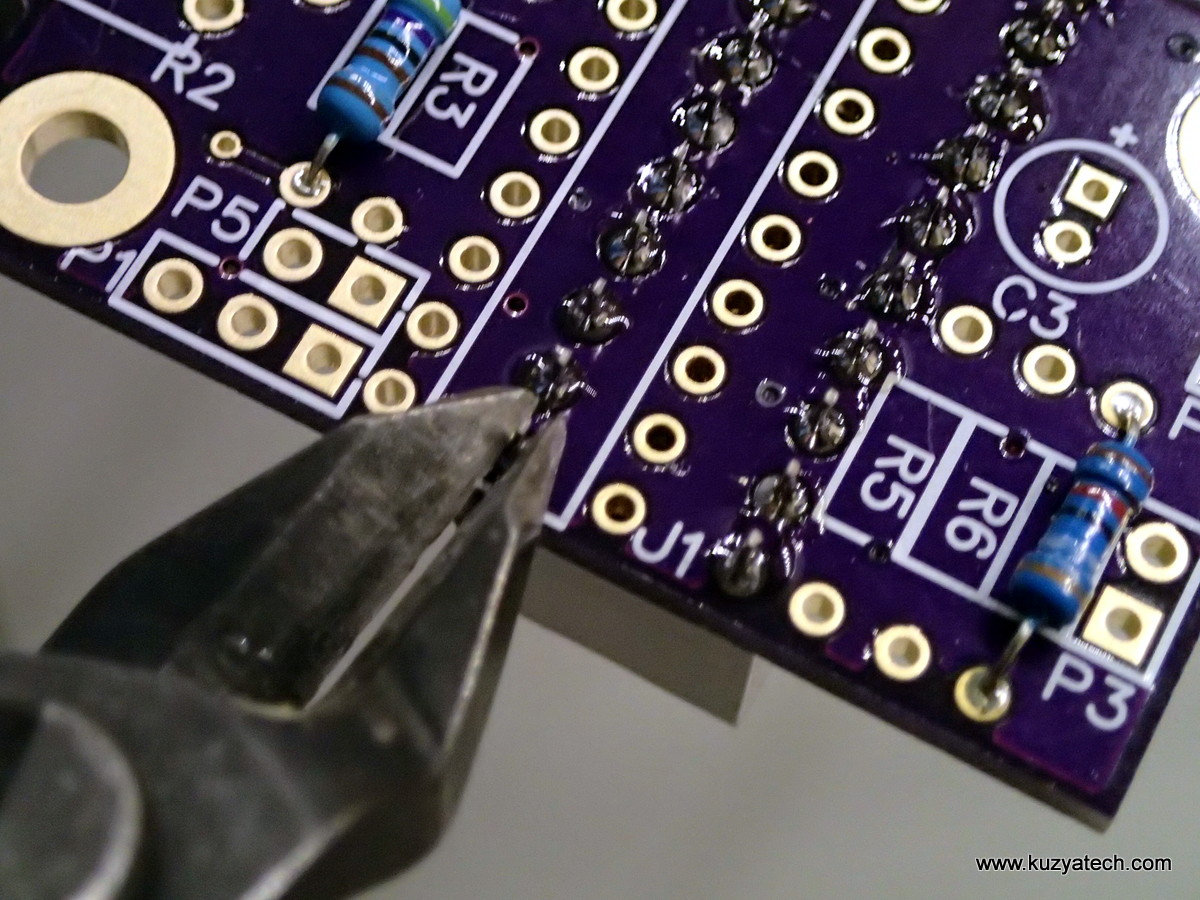
Important- carefully trim display pins after soldering
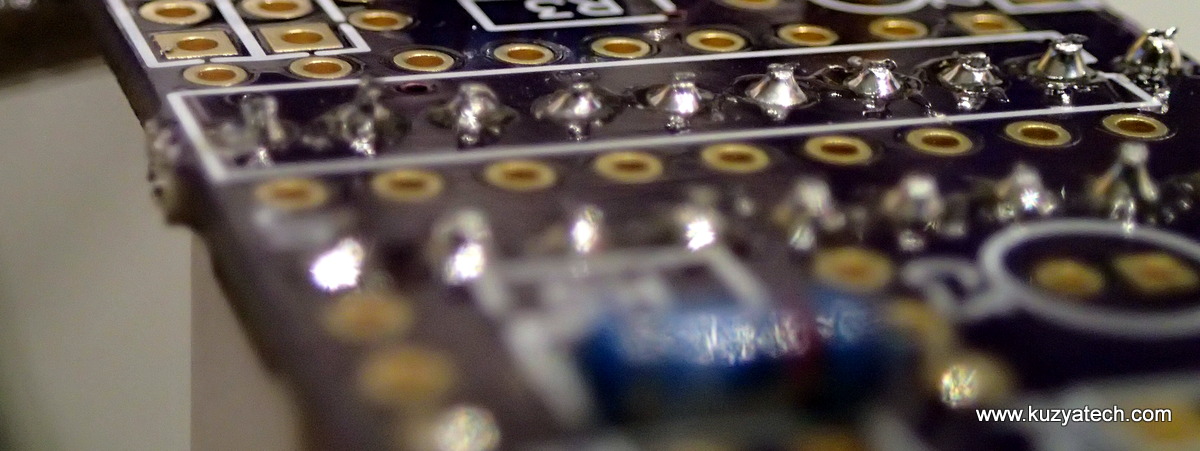
Trimmed pins
Install U1.

Solder one side of U1 pins from the top side

Solder the other side from the “normal” side

Install electrolytic cap C2. Pay attention to polarity- the side marked with a big minus side goes to the pin that has no + on the board
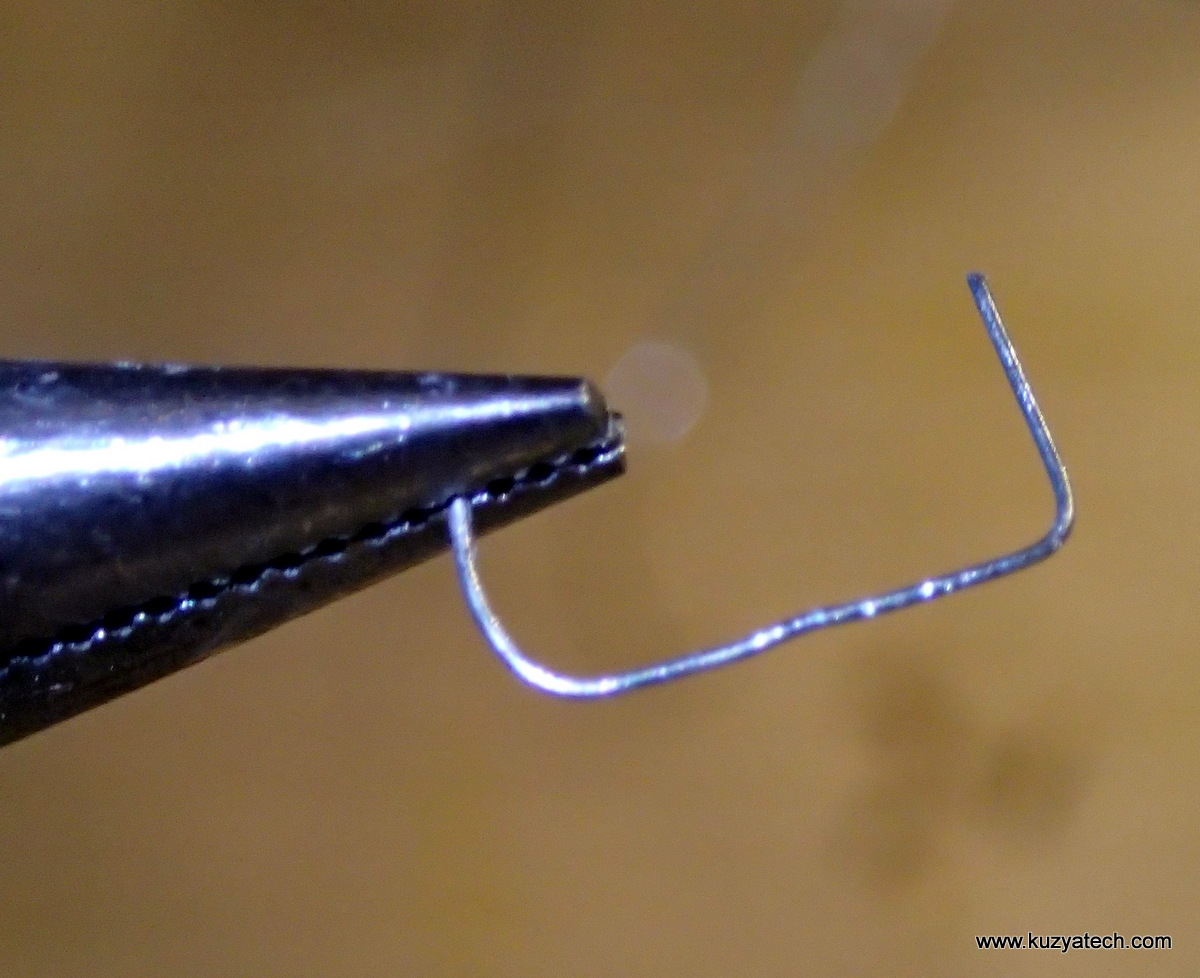
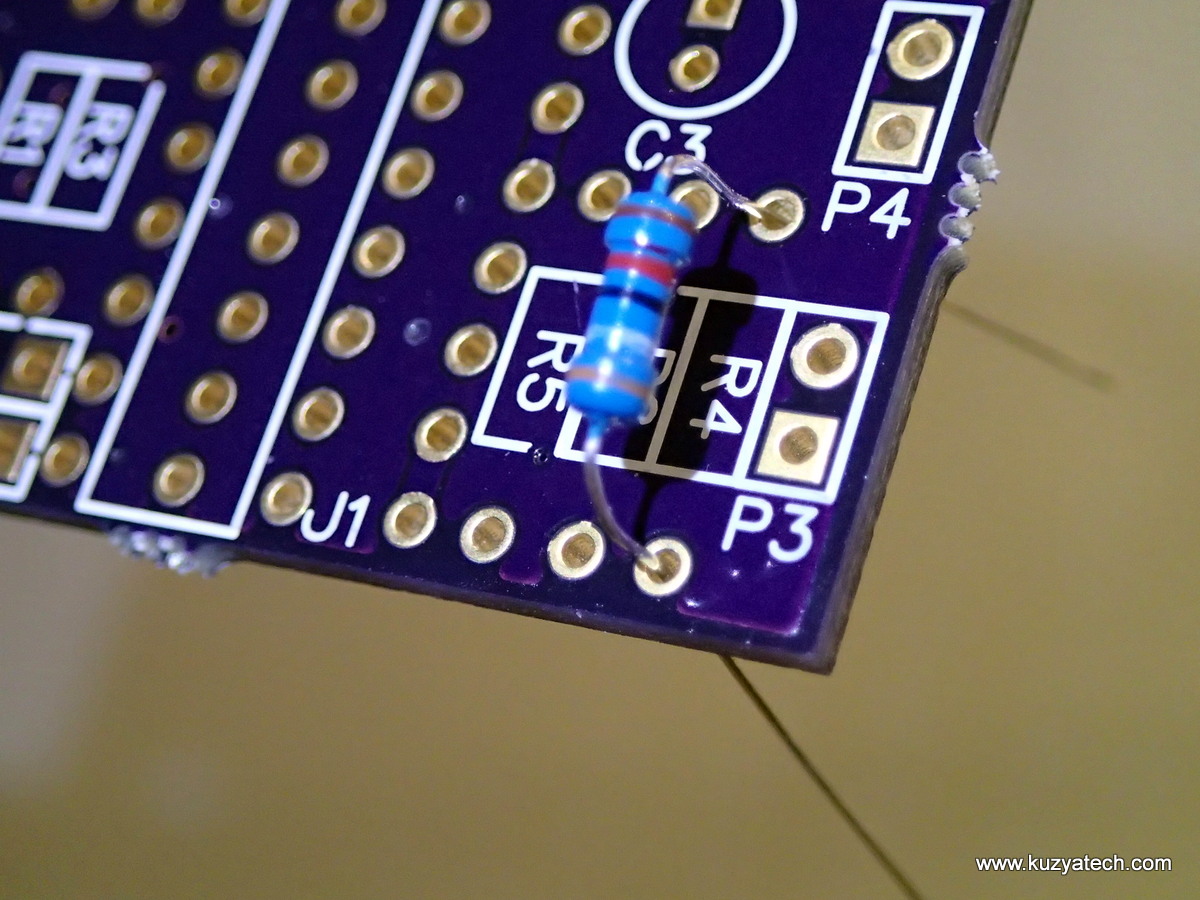
Another unusual step- using a pin cut off from one of the resistors after it’s been soldered, make a wire jumper and install in place of R3. Might as well not through something we can use!
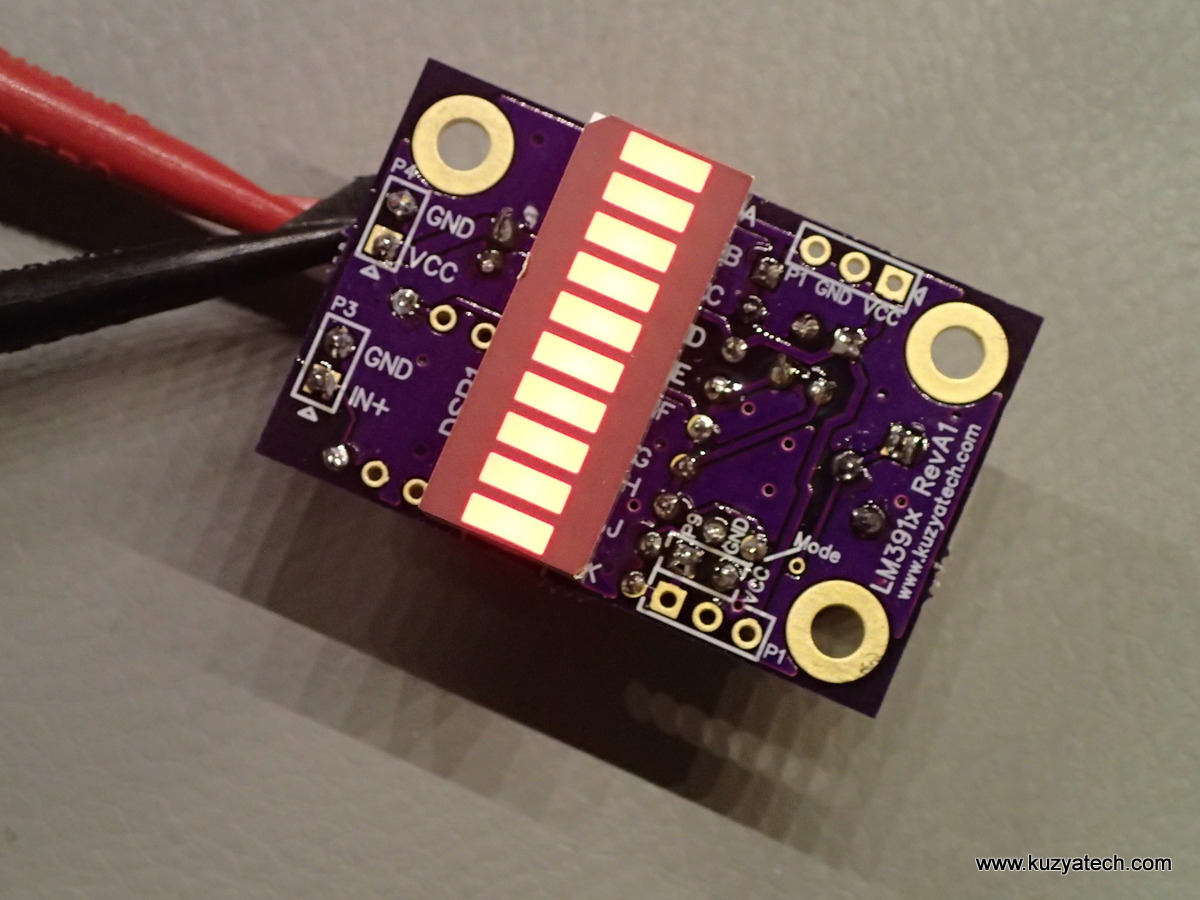
Assembled board in testing
Hello
Could you make me a quotation for two kits LM3916 LED bargraph/ VU meter
and tell me if it’s possible for me to pay on your account.
and the delivery time.
Thanks in advance
Michel
These kits are normally in stock in my Tindie store at https://www.tindie.com/products/kuzyatech/lm3916-led-bargraph-vu-meter-breakout-green/
and ship within 24 hours. At the moment they are sold out, and more are expected in two weekes or less. Delivery time varies by location/country as they go USPS First class or USPS priority mail. You’ll be able to see pricing and shipping options using the store link above. Thanks!
Have you got any VU-meter project that uses green, yellow and red bars, to go from fine levels (green), top levels (green) and peaks/distorted levels (red)?
That 10-segment bar seems to come only on a single color, and I need the three of them.
Several companies do make multicolor bargraph displays, for example Avago HDSP-4832. Unfortunately they will run backwards from what you want if used with my board. I.e. as voltage increases you’ll get 3 red bars, then 4 yellow and finally 3 green. This fits various battery monitoring applications better. So you’d need to find a display that has green in the low segments and red in the high.
So in the end there is no three-color bar meter that I can use for vu applications?
Pingback: LM3916 LED bargraph/ VU meter -Use Arduino for Projects
Hi…great work! Simply and compact.
I would know if it could be possible to make it working with a bargraph of 5 leds?
Would you use the same 10 segment bargraph and try to make them into dual segments or use a completely different LED module?
It’s a bit tricky- you’d have to rewire quite a bit. One way is by pairing two segments per driver output and adjusting dynamic range to only light them up.
Will I need a separate power supply for this vu meter or can I hook it up directly to my amp\speakers?
It needs power supply. Something like 5V is ideal. It can run off higher voltage say 12V ) but there will be more power dissipation in the chip (something like a 30C rise above ambient)
Hi Igor, when the LED bargraph signal is overloaded, instead of getting the all the LED’s light up solid as you would expect, they do something a bit freaky – any fix to tidy this up? Also is there any easy way to hold the peak LED level light for a second? Many thanks.
Scale things down a bit more or possibly diode clamp to an appropriate rail? I am not very familiar with peak hold operation though
sir
I want this circuit. how will get it .I am ready to pay cash
https://www.tindie.com/products/kuzyatech/lm3916-led-bargraph-vu-meter-breakout-green/
Can these be cascaded the way lm3916’s are? tie pin 4 to gnd on the low one?
Dave
Dear Sir,
This is Weyn from Kohon,Shenzhen,China.
We specialized in 7 segment led display,led diode,led dot matrix and other electronic components,and we have in this line for rich experience and win popular market.
We can do all kinds of sizes of 7 segment led display or OEM the product you need that can certainly suit your product,and can give you the best price.
Welcome to our website:www.kehongled.en.alibaba.com to choose what you want.
If you don’t want this now,please also keep this email,sometimes another choose might be helpful.
Best regards,
Weyn
Kohon Opto Electronics (ShenZhen)Co.,Ltd.
E-mail:sales6@kehongled.com
Skype:+8613554363131
WeChat:13554363131